> ## Documentation Index
> Fetch the complete documentation index at: https://docs.bugbybug.com/llms.txt
> Use this file to discover all available pages before exploring further.
# BugByBug OpenTelemetry
> Understand how OpenTelemetry fits into BugByBug workflow
## What is OpenTelemetry?
OpenTelemetry is an open-souce tool built for observing traces and metrics within your application.
It uses a set of APIs, agents or collector services to capture these traces.
OpenTelemetry (**OTLP**) is an open standard and ecosystem for collecting telemetry data from applications.
It lets you instrument your code once and send traces, metrics, and logs to many different observability backends (such as BugByBug in this case) without changing your application code.
Think of it like this:
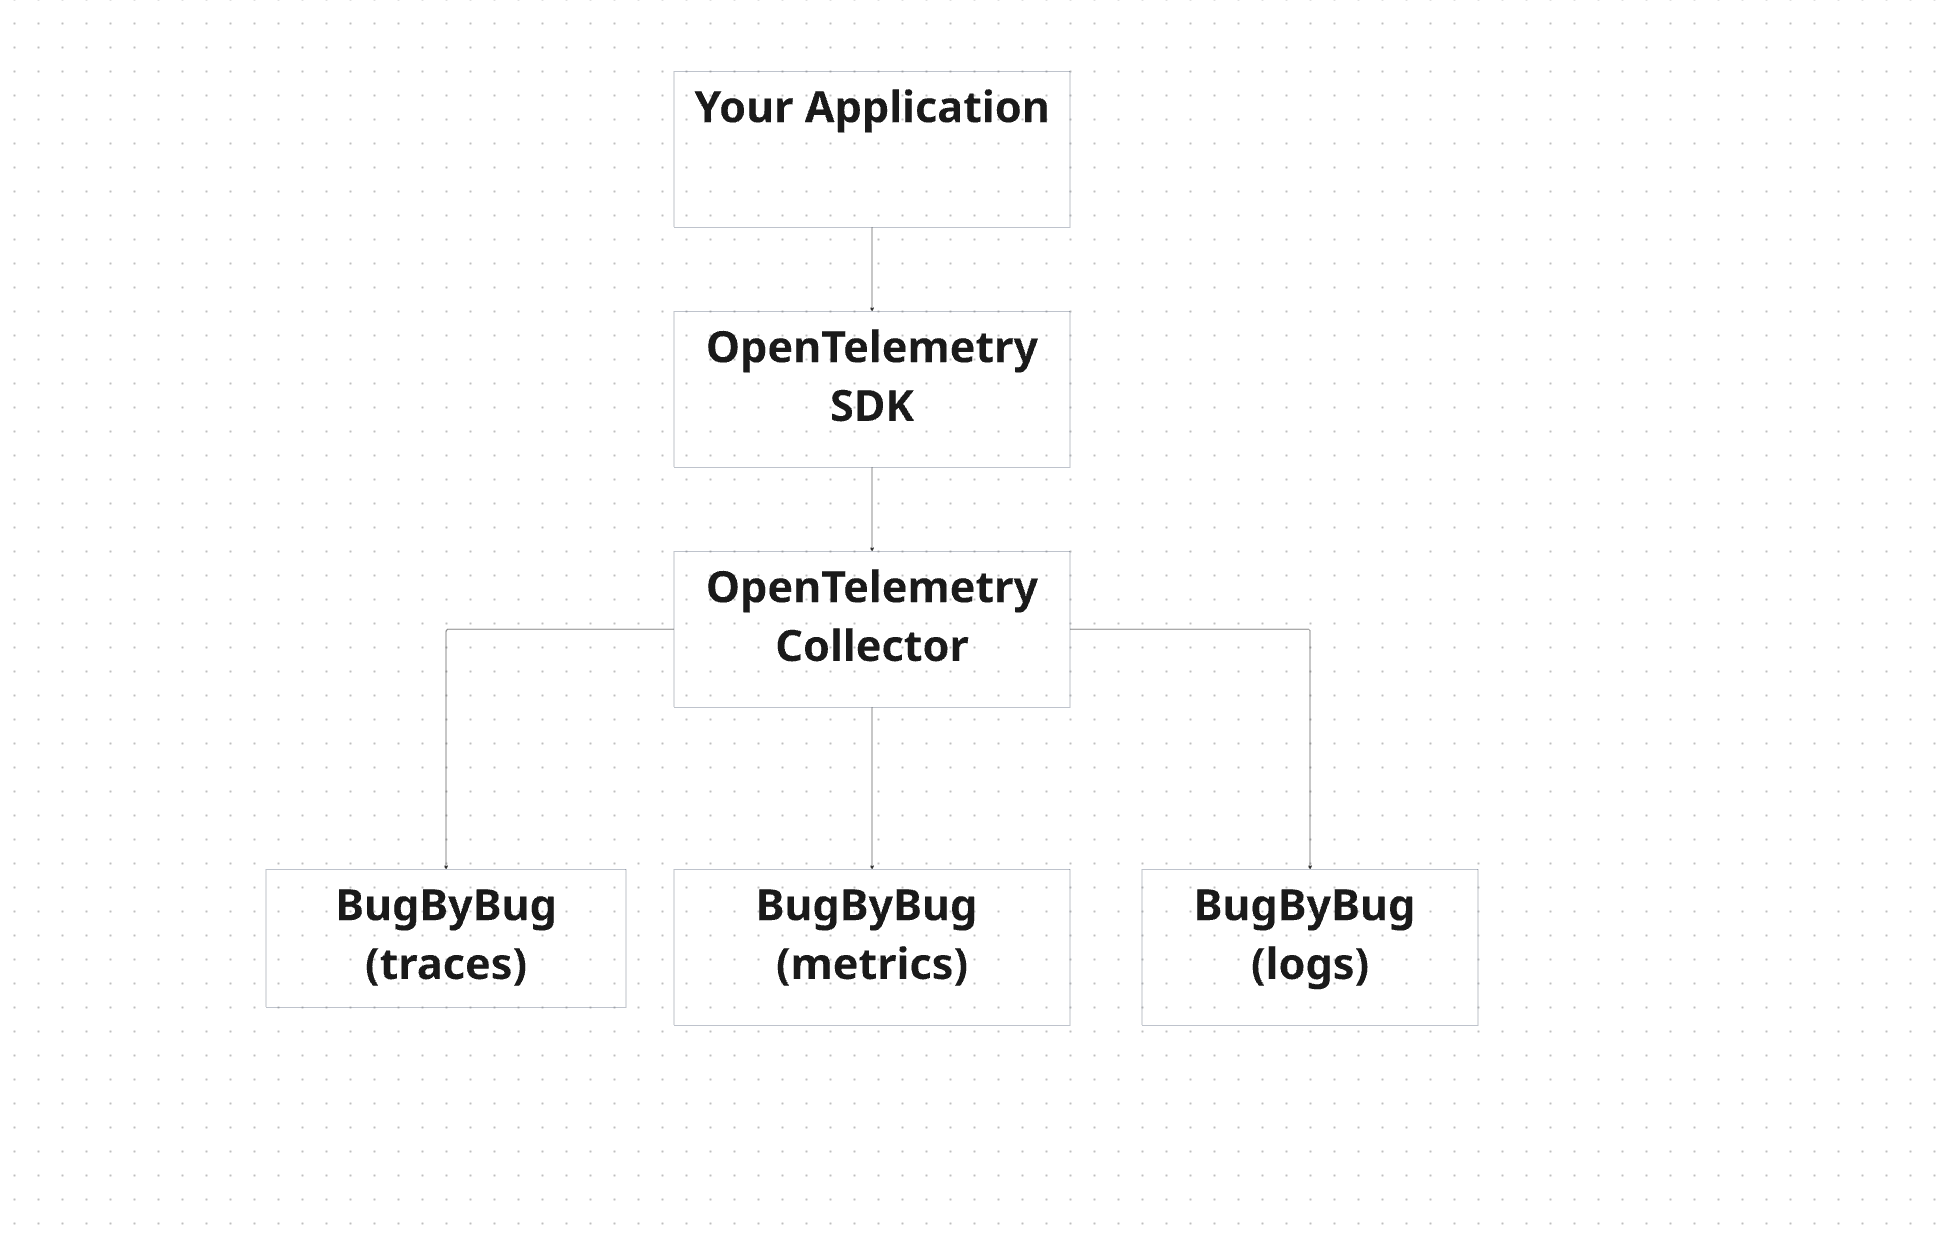 **OTLP** does not work alone, it needs what we call an *"OpenTelemetry Collector"* which helps it talk to BugByBug.
The OpenTelemetry Collector is a standalone service that sits between your applications and BugByBug.
Instead of your app or software talking directly to BugByBug, they send telemetry to the collector.
## Why BugByBug uses OpenTelemetry?
You might be wondering why BugByBug relies on OpenTelemetry. The short answer is that it lets us support a broad range of languages and frameworks through a standard, zero-friction integration path, so you can start sending telemetry without adopting a proprietary SDK.
At the same time, BugByBug still keeps the parts that matter for product quality and efficiency: secure authentication, intelligent filtering, and only storing the highest-signal exception data. That means you get a simpler setup experience without giving up performance or reliability.
## Connecting BugByBug to OpenTelemetry
To integrate BugByBug with OpenTelemetry in your project, include your BugByBug API key in the request headers using one of the following formats:
```zsh theme={null}
Authorization: Bearer YOUR_API_KEY
x-api-key: YOUR_API_KEY
```
Next, configure your OpenTelemetry HTTP exporter with the following settings:
* Endpoint: [https://nexus.bugbybug.com/v1/traces](https://nexus.bugbybug.com/v1/traces)
* Protocol: OTLP/HTTP
* Format: JSON (application/json)
## Configuring the OTLP HTTP exporter
Your OpenTelemetry exporter should point to BugByBug’s trace endpoint and include your API key in the request headers.
Although, the code example differ based on the language, but the authentication header stay the same.
```javascript helloWorld.js theme={null}
const { OTLPTraceExporter } = require('@opentelemetry/exporter-trace-otlp-http');
const exporter = new OTLPTraceExporter({
url: 'https://nexus.bugbybug.com/v1/traces',
headers: {
'x-api-key': ''
}
// Note: The Node.js HTTP exporter defaults to JSON automatically.
});
```
```C# helloWorld.cs theme={null}
using OpenTelemetry.Trace;
// Inside your TracerProviderBuilder configuration:
.AddOtlpExporter(opt =>
{
opt.Endpoint = new Uri("https://nexus.bugbybug.com/v1/traces");
opt.Protocol = OtlpExportProtocol.HttpJson; // Crucial for BugByBug
opt.Headers = "x-api-key=";
})
```
```python helloWorld.py theme={null}
from opentelemetry.exporter.otlp.proto.http.trace_exporter import OTLPSpanExporter
# Note: We recommend setting your exporter protocol to JSON via your environment variables:
# export OTEL_EXPORTER_OTLP_PROTOCOL=http/json
exporter = OTLPSpanExporter(
endpoint="https://nexus.bugbybug.com/v1/traces",
headers={"x-api-key": ""}
)
```
```go helloWorld.go theme={null}
import "go.opentelemetry.io/otel/exporters/otlp/otlptrace/otlptracehttp"
// When initializing your exporter:
exporter, err := otlptracehttp.New(ctx,
otlptracehttp.WithEndpointURL("https://nexus.bugbybug.com/v1/traces"),
otlptracehttp.WithHeaders(map[string]string{
"x-api-key": "",
}),
)
```
```java HelloWorld.java theme={null}
import io.opentelemetry.exporter.otlp.http.trace.OtlpHttpSpanExporter;
OtlpHttpSpanExporter exporter = OtlpHttpSpanExporter.builder()
.setEndpoint("https://nexus.bugbybug.com/v1/traces")
.addHeader("x-api-key", "")
.build();
```
## Capturing errors
BugByBug automatically reads standard OpenTelemetry exception events to populate your error dashboards.
When an operation fails, record the exception on the active span and set the span status to `ERROR` so the error appears correctly in BugByBug.
## Verify Your OTel Set Up
Verify your OpenTelemetry within BugByBug and track your bugs in real time.
**OTLP** does not work alone, it needs what we call an *"OpenTelemetry Collector"* which helps it talk to BugByBug.
The OpenTelemetry Collector is a standalone service that sits between your applications and BugByBug.
Instead of your app or software talking directly to BugByBug, they send telemetry to the collector.
## Why BugByBug uses OpenTelemetry?
You might be wondering why BugByBug relies on OpenTelemetry. The short answer is that it lets us support a broad range of languages and frameworks through a standard, zero-friction integration path, so you can start sending telemetry without adopting a proprietary SDK.
At the same time, BugByBug still keeps the parts that matter for product quality and efficiency: secure authentication, intelligent filtering, and only storing the highest-signal exception data. That means you get a simpler setup experience without giving up performance or reliability.
## Connecting BugByBug to OpenTelemetry
To integrate BugByBug with OpenTelemetry in your project, include your BugByBug API key in the request headers using one of the following formats:
```zsh theme={null}
Authorization: Bearer YOUR_API_KEY
x-api-key: YOUR_API_KEY
```
Next, configure your OpenTelemetry HTTP exporter with the following settings:
* Endpoint: [https://nexus.bugbybug.com/v1/traces](https://nexus.bugbybug.com/v1/traces)
* Protocol: OTLP/HTTP
* Format: JSON (application/json)
## Configuring the OTLP HTTP exporter
Your OpenTelemetry exporter should point to BugByBug’s trace endpoint and include your API key in the request headers.
Although, the code example differ based on the language, but the authentication header stay the same.
```javascript helloWorld.js theme={null}
const { OTLPTraceExporter } = require('@opentelemetry/exporter-trace-otlp-http');
const exporter = new OTLPTraceExporter({
url: 'https://nexus.bugbybug.com/v1/traces',
headers: {
'x-api-key': ''
}
// Note: The Node.js HTTP exporter defaults to JSON automatically.
});
```
```C# helloWorld.cs theme={null}
using OpenTelemetry.Trace;
// Inside your TracerProviderBuilder configuration:
.AddOtlpExporter(opt =>
{
opt.Endpoint = new Uri("https://nexus.bugbybug.com/v1/traces");
opt.Protocol = OtlpExportProtocol.HttpJson; // Crucial for BugByBug
opt.Headers = "x-api-key=";
})
```
```python helloWorld.py theme={null}
from opentelemetry.exporter.otlp.proto.http.trace_exporter import OTLPSpanExporter
# Note: We recommend setting your exporter protocol to JSON via your environment variables:
# export OTEL_EXPORTER_OTLP_PROTOCOL=http/json
exporter = OTLPSpanExporter(
endpoint="https://nexus.bugbybug.com/v1/traces",
headers={"x-api-key": ""}
)
```
```go helloWorld.go theme={null}
import "go.opentelemetry.io/otel/exporters/otlp/otlptrace/otlptracehttp"
// When initializing your exporter:
exporter, err := otlptracehttp.New(ctx,
otlptracehttp.WithEndpointURL("https://nexus.bugbybug.com/v1/traces"),
otlptracehttp.WithHeaders(map[string]string{
"x-api-key": "",
}),
)
```
```java HelloWorld.java theme={null}
import io.opentelemetry.exporter.otlp.http.trace.OtlpHttpSpanExporter;
OtlpHttpSpanExporter exporter = OtlpHttpSpanExporter.builder()
.setEndpoint("https://nexus.bugbybug.com/v1/traces")
.addHeader("x-api-key", "")
.build();
```
## Capturing errors
BugByBug automatically reads standard OpenTelemetry exception events to populate your error dashboards.
When an operation fails, record the exception on the active span and set the span status to `ERROR` so the error appears correctly in BugByBug.
## Verify Your OTel Set Up
Verify your OpenTelemetry within BugByBug and track your bugs in real time.